
The way businesses use information is changing rapidly. From small businesses to large organizations, companies rely on data to understand customers, improve operations, increase sales, reduce costs, and make better decisions. This growing dependence on data has created exciting opportunities for people who want to build a career in data analytics.
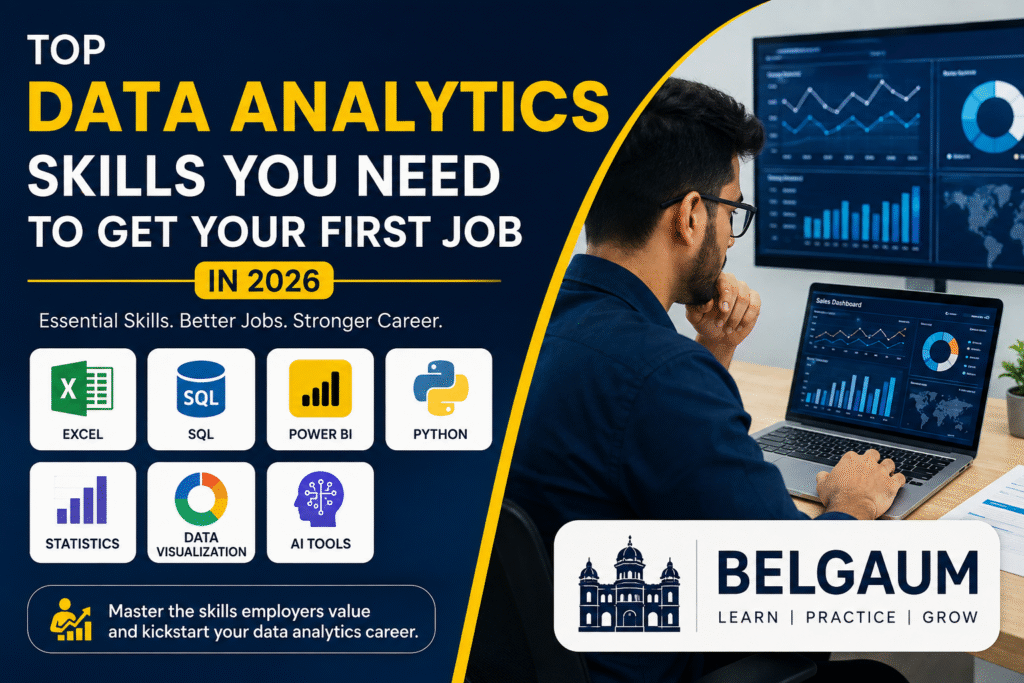
For students, freshers, and professionals looking for data analytics jobs, learning the right technical skills can significantly improve career opportunities. In 2026, knowing only one software tool may not be enough. Employers increasingly look for candidates who can work with spreadsheets, databases, dashboards, programming languages, statistics, visualization tools, and artificial intelligence.
If you are planning to start a career in data analytics in Belgaum, developing these skills can help you become better prepared for today’s job market.
What Does a Data Analyst Do?
A data analyst collects, cleans, analyzes, and interprets data to help organizations make informed decisions.
For example, a retail company may have thousands of sales transactions. A data analyst could examine that information to discover:
- Which products are selling the most?
- Which locations generate the highest revenue?
- Which months have the strongest sales?
- Which customers purchase most frequently?
- Why have sales increased or decreased?
The analyst then converts these findings into reports, dashboards, and recommendations that business teams can understand and use.
This means a successful data analyst needs both technical skills and business problem-solving skills.
1. Excel – The Essential Starting Point
Microsoft Excel remains one of the most important tools for people beginning a career in data analytics.
Businesses use Excel for financial analysis, sales reports, inventory management, customer information, budgeting, and operational reporting. Because of its widespread use, employers often expect entry-level candidates to have strong Excel knowledge.
Important Excel skills include:
- Formulas and functions
- XLOOKUP and VLOOKUP
- IF statements
- SUMIF and COUNTIF
- Pivot Tables
- Data cleaning
- Conditional formatting
- Charts
- Data validation
- Dashboard creation
For example, an analyst could use an Excel Pivot Table to compare sales across different cities, products, and months.
Learning Excel is an excellent first step because it teaches you how to organize, clean, summarize, and interpret data before moving into more advanced tools.
2. SQL – Work With Real Business Databases
SQL, or Structured Query Language, is one of the most valuable technical skills for data analytics jobs.
Companies store large amounts of information in databases. Analysts use SQL to retrieve specific information and answer business questions.
Important SQL concepts include:
- SELECT
- WHERE
- ORDER BY
- GROUP BY
- Aggregate functions
- JOIN
- CASE statements
- Subqueries
- Common Table Expressions
- Window functions
Imagine an e-commerce company wants to identify its top 10 customers by total spending. Instead of manually searching through thousands of records, a data analyst can use SQL to retrieve the required information within seconds.
Strong SQL skills show employers that you can work with structured business data and answer practical questions using databases.
3. Power BI – Transform Data Into Interactive Dashboards
Data is valuable only when people can understand it.
Power BI helps analysts transform raw information into interactive dashboards and reports. It is particularly useful for presenting business performance to managers and decision-makers.
A Power BI dashboard could display:
- Total sales
- Monthly revenue
- Customer growth
- Regional performance
- Product performance
- Marketing results
- Profit trends
- Key performance indicators
A good dashboard does more than display attractive charts. It tells a story.
For example, instead of giving a manager thousands of sales records, you could create a dashboard showing that sales have decreased in one region while another region has experienced strong growth.
For candidates preparing for data analytics jobs in Belgaum, Power BI projects can also become valuable additions to a professional portfolio.
4. Python – Automate and Analyze Data
Python has become an important programming language for data professionals.
You do not need to become an advanced software developer to start using Python for data analytics. Begin with the fundamentals and gradually learn popular libraries such as:
- Pandas
- NumPy
- Matplotlib
- Seaborn
- Scikit-learn
Python can be used to clean large datasets, automate repetitive tasks, perform calculations, analyze information, and create visualizations.
For example, if an analyst receives thousands of records every week, Python can help automate parts of the data-cleaning and reporting process.
Python can also provide a pathway toward advanced careers in data science, machine learning, and artificial intelligence.
5. Statistics – Understand the Story Behind Data
Knowing how to use tools is important, but understanding what the numbers actually mean is even more important.
Statistics provides the foundation for making reliable conclusions from data.
Aspiring data analysts should understand:
- Mean
- Median
- Mode
- Percentages
- Probability
- Standard deviation
- Distribution
- Correlation
- Sampling
- Hypothesis testing
- Basic regression
Suppose a company’s sales increase by 20%. A good analyst should not immediately conclude that the business is performing better.
They should investigate what caused the increase.
Was it a marketing campaign? A seasonal trend? A new product? A price change? Or a temporary event?
Statistical knowledge helps analysts ask these questions and avoid misleading conclusions.
6. Data Visualization – Communicate Insights Clearly
Data visualization is the process of presenting information through charts, graphs, and dashboards.
Good visualization makes complicated information easier to understand.
Common visualizations include:
- Bar charts
- Line charts
- Pie charts
- Scatter plots
- Maps
- KPI cards
- Interactive dashboards
However, data visualization is not simply about making dashboards look attractive.
The goal is to communicate the right message.
For example, a line chart can show how sales change over time, while a bar chart can make it easier to compare product performance.
Employers value analysts who can transform complex datasets into simple and understandable business stories.
7. AI Tools – The New Skill for Modern Data Analysts
Artificial intelligence is changing the way data analysts work.
In 2026, AI tools can assist analysts with many everyday tasks, including:
- Generating Excel formulas
- Explaining SQL queries
- Writing Python code
- Summarizing datasets
- Suggesting data-cleaning methods
- Identifying potential trends
- Creating report summaries
- Brainstorming dashboard ideas
- Automating repetitive tasks
For example, a beginner who struggles with an SQL query can ask an AI tool to explain the query and identify potential errors.
AI can make analysts more productive, but it does not replace analytical thinking.
You still need to understand the business problem, verify the output, check data quality, and make the final judgment.
The future of data analytics is likely to involve professionals who know how to combine traditional analytical skills with AI.
Why Employers Value These Skills
Employers are not simply looking for candidates who know software.
They want people who can solve business problems.
A strong candidate might use Excel to clean a dataset, SQL to retrieve information from a database, Python to automate analysis, Power BI to create a dashboard, statistics to validate findings, and AI tools to improve productivity.
This combination creates a complete analytical workflow.
Employers also value candidates who can communicate their findings clearly. Being able to explain what happened, why it happened, and what the business should do next can make you stand out during an interview.
Build a Portfolio Before Applying for Jobs
Learning tools is important, but practical experience is even more valuable.
If you are a fresher looking for data analytics jobs, create projects that demonstrate your skills.
Some useful portfolio ideas include:
Sales Analytics Dashboard
Analyze sales data to identify revenue trends, top products, regional performance, and monthly growth.
Customer Analysis
Study customer purchasing patterns and identify high-value customer segments.
Marketing Analytics
Analyze advertising data to understand clicks, conversions, campaign performance, and customer acquisition.
Financial Dashboard
Create a dashboard showing income, expenses, profit, and financial trends.
E-Commerce Analytics
Analyze online orders to understand popular products, customer behavior, order values, and sales trends.
For every project, explain the business problem, data-cleaning process, analysis, visualizations, key insights, and recommendations.
Career Opportunities in Data Analytics
After developing the right skills, you can explore several career paths, including:
- Data Analyst
- Junior Data Analyst
- Business Analyst
- Reporting Analyst
- MIS Analyst
- Marketing Analyst
- Operations Analyst
- Business Intelligence Analyst
- Financial Data Analyst
The exact requirements vary between companies, but a combination of Excel, SQL, Power BI, Python, statistics, visualization, and AI can provide a strong foundation.
Starting a Data Analytics Career in Belgaum
For students and professionals in Belgaum, learning data analytics can open opportunities across industries such as manufacturing, retail, healthcare, finance, education, marketing, and technology.
Local companies increasingly need professionals who can understand sales information, customer behavior, financial reports, inventory data, and operational performance.
You should also consider remote and hybrid opportunities when searching for jobs. Building skills that are useful across different industries and locations can significantly expand your career options.
If you are looking for data analytics courses in Belgaum, choose training that combines classroom concepts with practical projects, SQL exercises, Power BI dashboards, Python, statistics, and AI tools.
Final Thoughts
Getting your first data analytics job in 2026 requires more than learning a single software program.
Build a strong foundation with Excel and statistics. Learn SQL to work with databases. Master Power BI and data visualization to communicate insights. Add Python for automation and advanced analysis. Finally, learn how to use AI tools responsibly to become more productive.
Most importantly, practice what you learn through real-world projects.
For aspiring data analysts in Belgaum, the combination of technical skills, practical projects, communication, and AI knowledge can help you become better prepared for today’s competitive job market.
Start small, practice consistently, build your portfolio, and keep learning. Your first data analytics job can be the beginning of a long-term career in one of the most exciting areas of the modern digital economy.